Gregor Mendel proposed that an organism carries 2 units for each visible character but contributes only one unit to each of its offsprings. Medel worked with garden peas as they are true-bredding (self-fertilized offspring display the same form of trait as their parent). He noted patterns of inheritence that were consistent and have eventually become known as "Laws", which are consistent due to the nature of genes, chromosomes and gametes (sperm, eggs, pollen).
Why Corn?
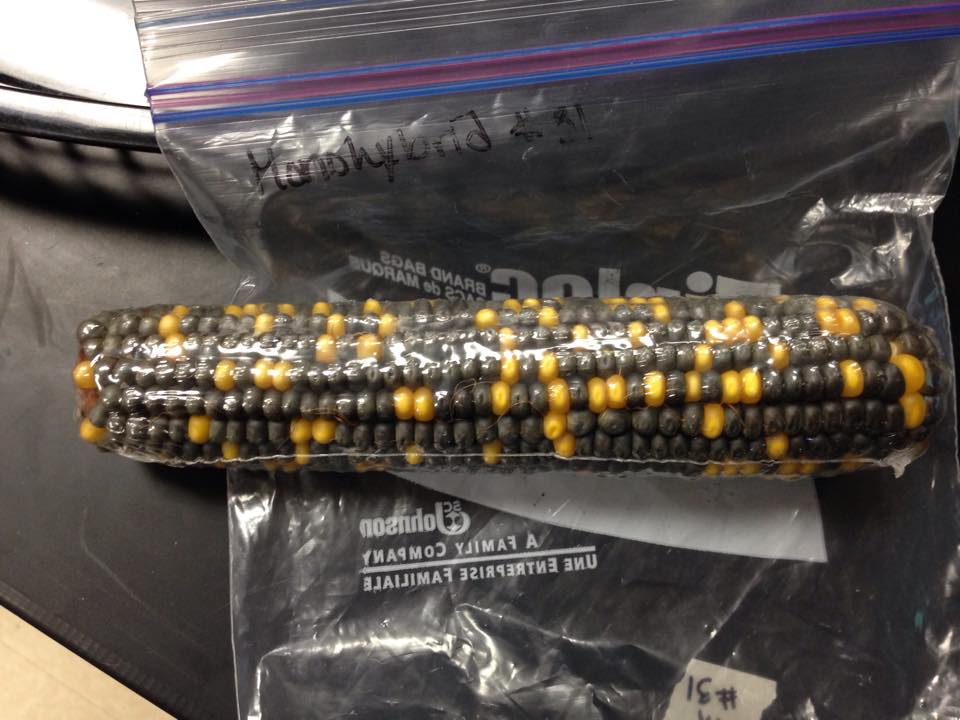
We use corn for this experiment because mature corn plants produce ears that contain hundreds of seeds of kernels. Each seed/kernel is formed by the fertilization of an egg by a male gamete (pollen). Therefore, each kernel of corn on an ear of corn can grow into a whole new plant that contains a complete set of chromosomes found in corn. We use an entire corn cob because a single cob contains hundreds of offspring from a single parental cross and illustrates the results of traits being passed on from parents to a large number of offspring.
Monohybrid (a single trait that results from a single gene) and Dihybrid (two traits that result from two separate genes on two separate chromosomes) crosses. Looking at the physical appearance of the corn kernels to determine the phenotype of two characters: kernels color and carbohydrate content. There are 2 different alleles for each gene: purple vs yellow, and smooth vs wrinkled. The results illustrates: Mendel's Law of Inheritance: The Law of Segregation and The Law of Independent Assortment.
According to Independent Assortment, different pairs of alleles are passed to offspring independently of each other. In our corn, that means that a kernel of corn has an equal chance of being purple and smooth as it does purple and wrinkled, same with yellow, because the alleles separate into gametes independently of one another during meiosis when the gametes are being formed and the chromosomes are separating.
The color variants that they have are purple (dominant) and yellow (recessive). Smooth in appearance (dominant) and wrinkled in appearance (recessive).
Why Corn?
We use corn for this experiment because mature corn plants produce ears that contain hundreds of seeds of kernels. Each seed/kernel is formed by the fertilization of an egg by a male gamete (pollen). Therefore, each kernel of corn on an ear of corn can grow into a whole new plant that contains a complete set of chromosomes found in corn. We use an entire corn cob because a single cob contains hundreds of offspring from a single parental cross and illustrates the results of traits being passed on from parents to a large number of offspring.
Monohybrid (a single trait that results from a single gene) and Dihybrid (two traits that result from two separate genes on two separate chromosomes) crosses. Looking at the physical appearance of the corn kernels to determine the phenotype of two characters: kernels color and carbohydrate content. There are 2 different alleles for each gene: purple vs yellow, and smooth vs wrinkled. The results illustrates: Mendel's Law of Inheritance: The Law of Segregation and The Law of Independent Assortment.
According to Independent Assortment, different pairs of alleles are passed to offspring independently of each other. In our corn, that means that a kernel of corn has an equal chance of being purple and smooth as it does purple and wrinkled, same with yellow, because the alleles separate into gametes independently of one another during meiosis when the gametes are being formed and the chromosomes are separating.
The color variants that they have are purple (dominant) and yellow (recessive). Smooth in appearance (dominant) and wrinkled in appearance (recessive).
Procedures:
Developing Null Hypothesis: Monohybrid Corn A
Developing Null Hypothesis: Monohybrid Corn A
- Students will work in pairs
- Start with a monohybrid cross; obtain a corncob labeled A
- Draw two punnet squares for the possible crosses to represent the null hypothesis. Label punnet squares as null hypothesis number one or number two.
|
MONOHYBRID CORN A Possible Crosses of Corn A |
|
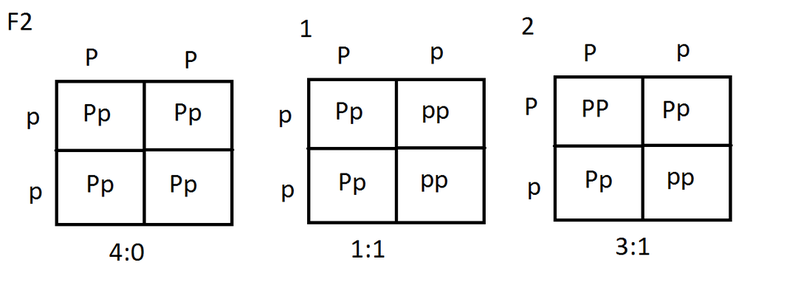
Null Hypothesis number 1
Look at your punnet square crosses and record information about F2 generation
Look at your punnet square crosses and record information about the F2 generation.
What proportion of the kernels on your cob do you expect to be purple? 1/2 (50%)
What proportion of the kernels on your cob do you expect to be yellow? 1/2 (50%)
Null Hypothesis 2
What proportion of the kernels on your cob do you expect to be purple? 3/4 (75%)
What proportion of the kernels on your cob do you expect to be yellow? 1/4 (25%)
Look at your punnet square crosses and record information about F2 generation
- Gametes of the F1: P , p
- Genotypes of the F2: PP , Pp , pp
- Phenotypes of the F2: Purple and Yellow
Look at your punnet square crosses and record information about the F2 generation.
- Gametes of the F1: P , p
- Genotypes of the F2: Pp , pp
- Phenotypes of the F2: Purple and Yellow
What proportion of the kernels on your cob do you expect to be purple? 1/2 (50%)
What proportion of the kernels on your cob do you expect to be yellow? 1/2 (50%)
Null Hypothesis 2
What proportion of the kernels on your cob do you expect to be purple? 3/4 (75%)
What proportion of the kernels on your cob do you expect to be yellow? 1/4 (25%)
Statistical background: In science, we form hypotheses to try to explain something. We then design an experiment to test the hypothesis. The hypothesis predicts that we will get certain results from the experiment. But if, in fact, we get these results, is it possible that the results are due to chance, rather than that the hypothesis is correct? This is possible, so we use statistical test called Chi Square to let us know the likelihood that our results were due to chance, rather than the hypothesis being correct. This single value x^2 can than be compared to a Chi Square Table of probabilities to determine at what level of confidence you can trust that your collected data actually reflects the expected values.

Degree of Freedom = Number of classes subtracted by 1
In this case there are only 2 so the Degree of freedom is (2-1=1) 1.
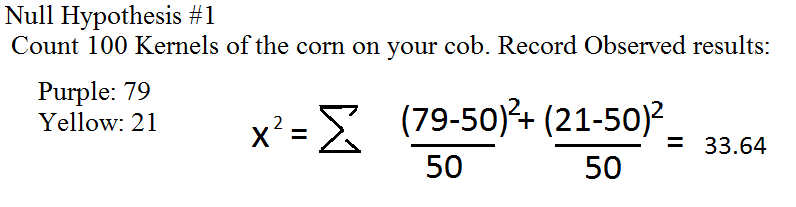
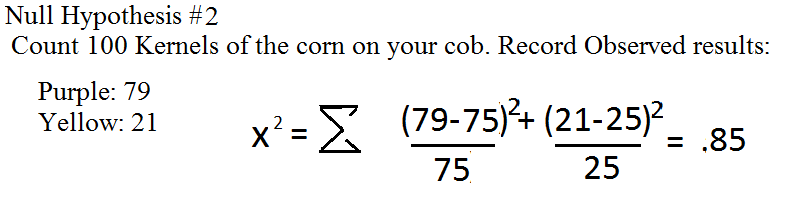
Use the data that you obtained by counting 100 kernels and calculate the chi square value.
Find the sum of the "deviation squared/expected" to determine your chi square value.
Do your results agree with the proportions you expected after you have completed the chi-square test? Yes!
Chi Square Probability Value for Null Hypothesis #1: .01<p<.001
Chi Square Probability Value for Null Hypothesis #2: .90>p>.50
Which is the correct value? Explain why?
The correct value is hypothesis #2 because the chi square value numbers fits into the acceptable side of the probability chart. Hypothesis #1 was not in the acceptable side and will be rejected.
In this case there are only 2 so the Degree of freedom is (2-1=1) 1.
Use the data that you obtained by counting 100 kernels and calculate the chi square value.
Find the sum of the "deviation squared/expected" to determine your chi square value.
Do your results agree with the proportions you expected after you have completed the chi-square test? Yes!
Chi Square Probability Value for Null Hypothesis #1: .01<p<.001
Chi Square Probability Value for Null Hypothesis #2: .90>p>.50
Which is the correct value? Explain why?
The correct value is hypothesis #2 because the chi square value numbers fits into the acceptable side of the probability chart. Hypothesis #1 was not in the acceptable side and will be rejected.
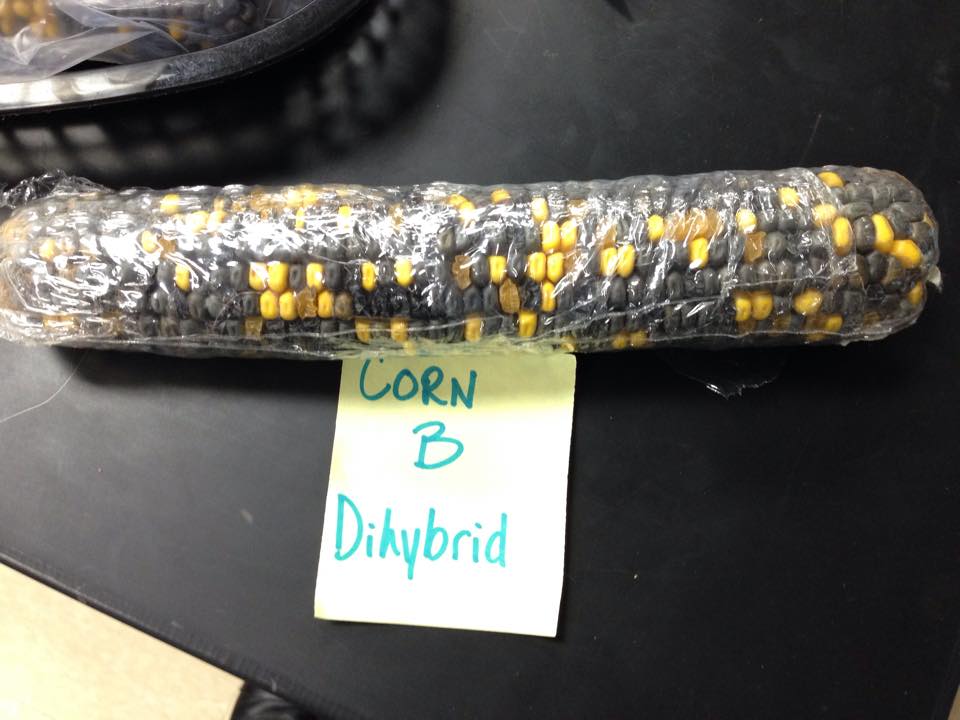
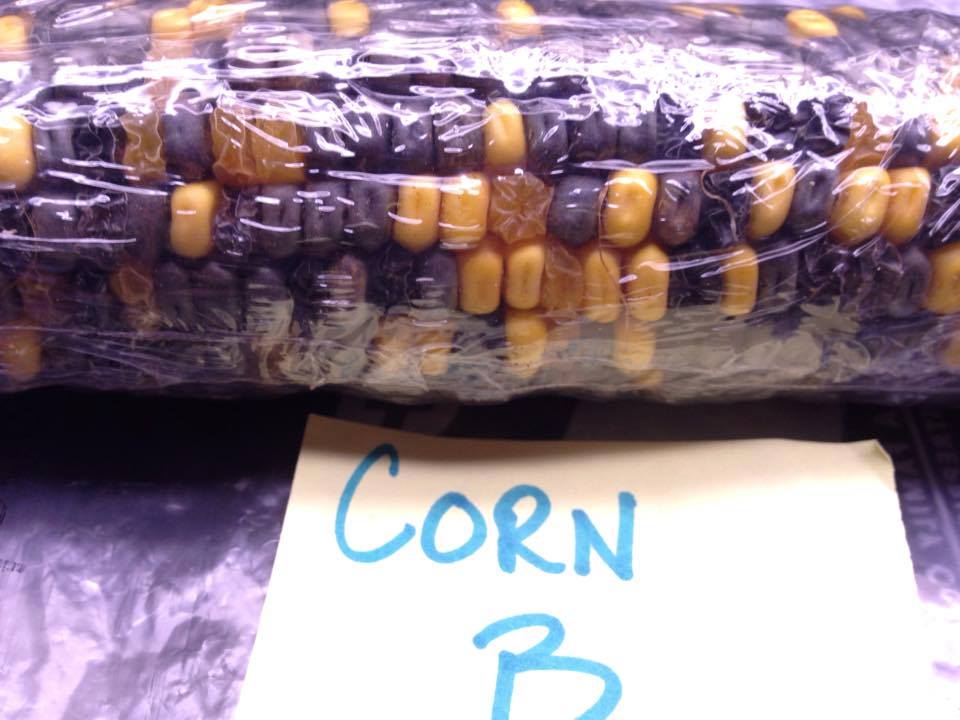
Dihybrid Cross: P1 cross = PPSS x ?? ?? , F2 generation is Corn B
|
|
Now you will begin the dihybrid cross; obtain a corncob labeled B. These photos of an ear of "corncob B" illustrates the F2 generation form a dihybrid cross, showing the four different genes and grain types. In the photo, there are four grain phenotypes in the ear of genetic corn: Purple and Smooth, Purple and Wrinkled, Yellow and Smooth and Yellow and Wrinkled. These four grain phenotypes are produced by the 2 pairs of heterozygous genes (P & p and S & s) located on 2 pairs of homologous chromosomes, each gene on a separate chromosome. The Law of Independent Assortment is easily demonstrated using an F2 cross (second generation using F1 x F1) in which the original parents P1 used for making the F1 is differed in 2 traits.
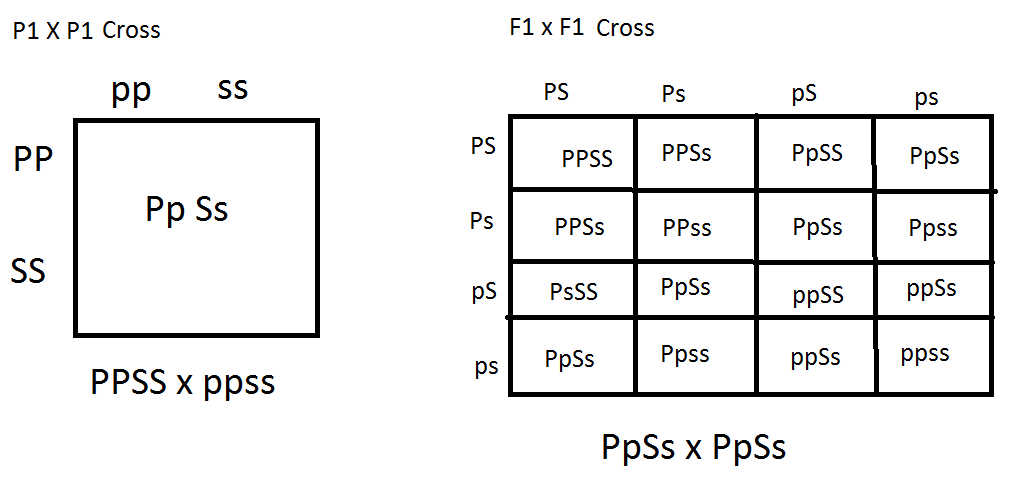
Draw a Punnet square for the P1 x P2 cross. Then draw a punnet square for the F1 x F1 cross (self fertilization).
Draw a Punnet square for the P1 x P2 cross. Then draw a punnet square for the F1 x F1 cross (self fertilization).
From your F1 x F1 Punnet square cross, examine the F2 generation
What is the predicted Null Hypothesis genotype for the F1 Parents? PpSs PpSs
Answer the questions based on your F1 x F1 Punnet Square ratio
What ratio of the kernels on your cob do you expect to be Purple and Smooth? 5/8 (.56)
What ratio of the kernels on your cob do you expect to be Purple and Wrinkled? 3/16 (.18)
What ratio of kernels on your cob do you expect to be Yellow and Smooth? 3/16 (.18)
What ratio of kernels on your cob do you expect to be Yellow and Wrinkled? 1/16 (.06)
-Count 100 kernels of the corn of cob
Record results.
Observed Purple and Smooth: 51 Observed Purple and Wrinkled: 18
Observed Yellow and Smooth: 24 Observed Yellow and Wrinkled: 7
Find x^2 Probability Values on your Chi Square Table.
Your Degree of Freedom = 3
(4-1=3) There are 4 classes in a Dihybrid Cross so you subtract 4 by 1 to get the Degree of Freedom.
- List the Gametes: PS , Ps , pS , ps
- List the genotypes: PPSS , PpSS , ppSS , PPSs , ppss , PpSs , PpSS , ppSs , ppss
- List the phenotypes: Purple/Smooth, Purple/Wrinkled, Yellow/Smooth, Yellow/Wrinkled
What is the predicted Null Hypothesis genotype for the F1 Parents? PpSs PpSs
Answer the questions based on your F1 x F1 Punnet Square ratio
What ratio of the kernels on your cob do you expect to be Purple and Smooth? 5/8 (.56)
What ratio of the kernels on your cob do you expect to be Purple and Wrinkled? 3/16 (.18)
What ratio of kernels on your cob do you expect to be Yellow and Smooth? 3/16 (.18)
What ratio of kernels on your cob do you expect to be Yellow and Wrinkled? 1/16 (.06)
-Count 100 kernels of the corn of cob
Record results.
Observed Purple and Smooth: 51 Observed Purple and Wrinkled: 18
Observed Yellow and Smooth: 24 Observed Yellow and Wrinkled: 7
Find x^2 Probability Values on your Chi Square Table.
Your Degree of Freedom = 3
(4-1=3) There are 4 classes in a Dihybrid Cross so you subtract 4 by 1 to get the Degree of Freedom.
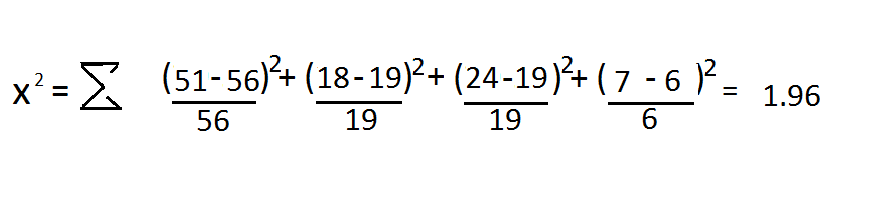
Chi Square Probability Values: .90>p>.50
Did you reject or accept your Null Hypothesis? Explain:
I would accept my Null Hypothesis because it is in between the acceptable side of the probability chart.
Did you reject or accept your Null Hypothesis? Explain:
I would accept my Null Hypothesis because it is in between the acceptable side of the probability chart.
Dihybrid Cross: F1 Cross = P_S_ x ?? ??, F2 generation is Corn C.
|
|
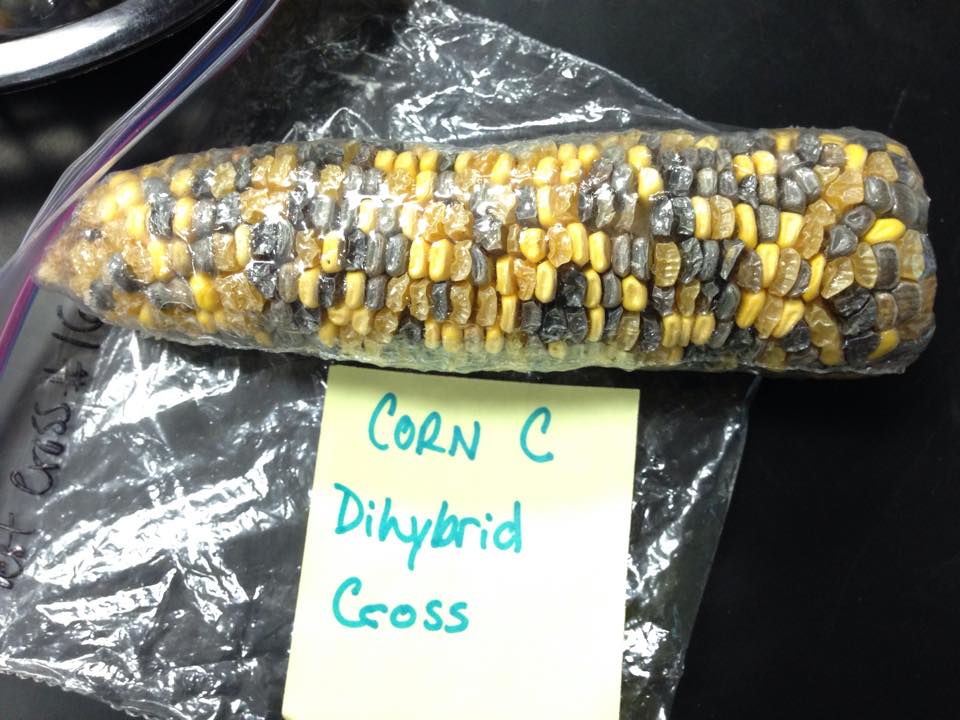
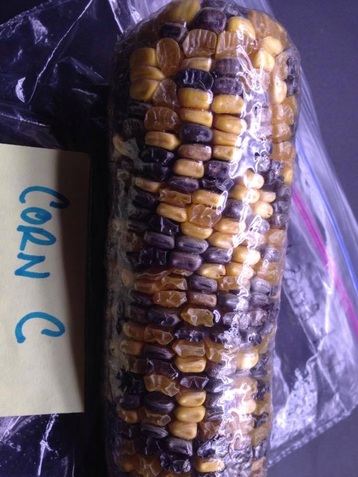
Now you will begin another dihybrid cross; obtain a corncob labeled C. Corncob C shows four different genes and grain types. There are four grain phenotypes in the ear of genetic corn: Purple & Smooth, Purple & Wrinkled, Yellow & Smooth and Yellow & Wrinkled. These four grains phenotypes are produced by the two pairs of genes (P & p and S & s) located on two pairs of homologous chromosomes, each gene on separate chromosome. Examining the ear of corn, think of the possible null hypothesis ratio which explains the phenotypical characteristics of corn C. The original P1 was purple, smooth and the other P1 yellow, wrinkled.
Draw a Punnet Square to predict a possible F1 x F1 cross. Then predict the F1 x F1 Cross.
From your F1 x F1 Punnet Square cross
Answer the questions based on your F1 x F1 Punnet square
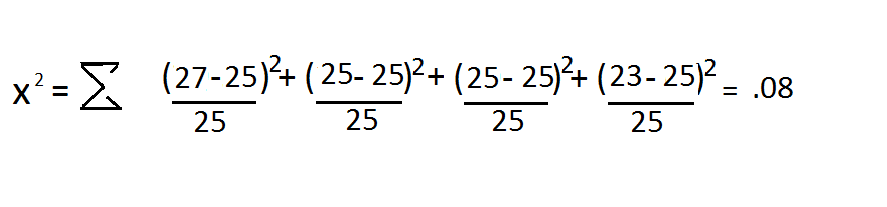
What ratio of the kernels on your cob do you expect to be Purple and Smooth? 25
What ratio of the kernel on your cob do you expect to be Purple and Wrinkled? 25
What ratio of the kernels on your cob do you expect to be Yellow and Smooth? 25
What ratio of the kernels on your cob do you expect to be Yellow and Wrinkled? 25
Count 100 Kernels of the corn on your cob.
Record your results.
Observed Purple and Smooth: 27 Observed Purple and Wrinkled: 25
Observed Yellow and Smooth: 25 Observed Yellow and Wrinkled: 23
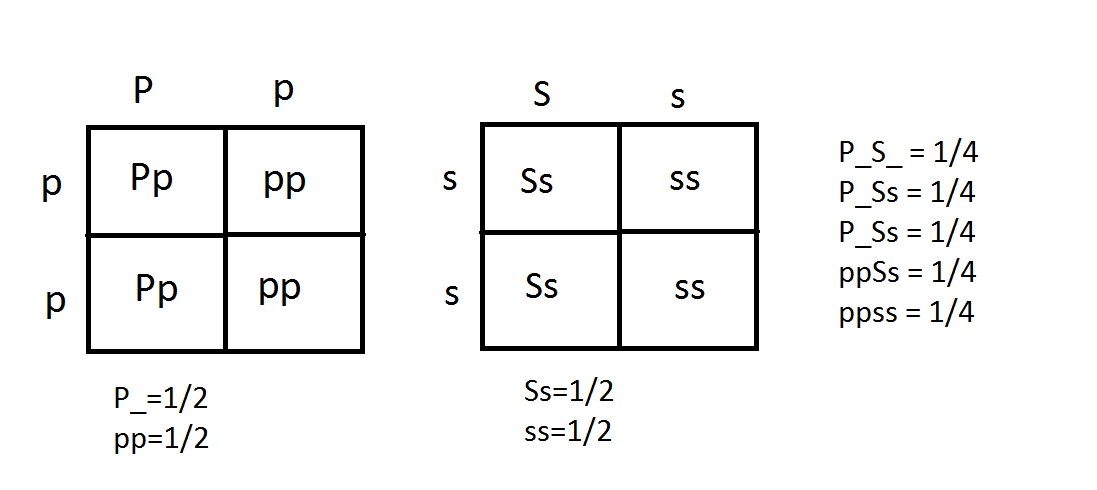
- List of Gametes:P , p
- List of genotypes: PpSs, Ppss, ppSs, ppss
- List of phenotypes: Purple/Smooth, Yellow/Smooth, Purple/Wrinkled and Yellow/Wrinkled
Answer the questions based on your F1 x F1 Punnet square
What ratio of the kernels on your cob do you expect to be Purple and Smooth? 25
What ratio of the kernel on your cob do you expect to be Purple and Wrinkled? 25
What ratio of the kernels on your cob do you expect to be Yellow and Smooth? 25
What ratio of the kernels on your cob do you expect to be Yellow and Wrinkled? 25
Count 100 Kernels of the corn on your cob.
Record your results.
Observed Purple and Smooth: 27 Observed Purple and Wrinkled: 25
Observed Yellow and Smooth: 25 Observed Yellow and Wrinkled: 23
(Find x^2 Probability Values on your Chi Square Table).
Your Degree of Freedom = 3
There are 4 classes in a Dihybrid cross, so you subtract 4 by 1. (4-3=1)
Chi Square Probability Values: .9>p>.5
Did you reject or accept your null hypothesis? Explain
I accept the my null hypothesis because the value is in the acceptable side of the probability chart.
Your Degree of Freedom = 3
There are 4 classes in a Dihybrid cross, so you subtract 4 by 1. (4-3=1)
Chi Square Probability Values: .9>p>.5
Did you reject or accept your null hypothesis? Explain
I accept the my null hypothesis because the value is in the acceptable side of the probability chart.
The result is that new combinations of genes present in neither parent are possible and there is a tremendous amount of diversity within a population. This experiment demonstrated the two basic laws of Mendelian inheritance. The chi square allowed us to determine whether the data obtained from various genetic crosses were consistent with Mendel's Laws.
